Please refer to Data Visualization Using Pyplot Class 12 Computer Science Notes and important questions below. The Class 12 Computer Science Chapter wise notes have been prepared based on the latest syllabus issued for the current academic year by CBSE. Students should revise these notes and go through important Class 12 Computer Science examination questions given below to obtain better marks in exams
Data Visualization Using Pyplot Class 12 Computer Science Notes and Questions
The below Class 12 Data Visualization Using Pyplot notes have been designed by expert Computer Science teachers. These will help you a lot to understand all the important topics given in your NCERT Class 12 Computer Science textbook. Refer to Chapter 15 Data Visualization Using Pyplot Notes below which have been designed as per the latest syllabus issued by CBSE and will be very useful for upcoming examinations to help clear your concepts and get better marks in examinations.
- Data visualization basically refers to the graphical or visual representation of information and data using charts, graphs, maps
- Data visualization helps for better understanding of the meaning of data.
- pyplot is a collection of methods which exists in matplotlib library.
- Pyplot allow user to construct 2D plots easily and interactively.
- To install the matplotlib :
- pip install matplotlib
- Commonly used chart types:
- Line Chart
- Bar Chart
- Pie Chart
- Line Chart: A line chart displays information as a series of data points called “markers”.
- Pyplot provides plot() function to create line graph
- To set the lables for x-axis and y-axis, xlabel( ) and ylabel( ) functions are used.
- Use show( ) function to display the line.
- Python program to draw a line graph for a list of values:
import matplotlib.pyplot as pl #pl is alias for matplot.pyplot
x=[2, 8] # values of x1 and x2
y=[5, 10] #values of y1 and y2
pl.plot(x,y) # to create a line
pl.xlabel(“Time”) #label name for x-axis
pl.ylabel(“Distance”) #label name for y-axis
pl.show() #to show the line
Output:

- Change the line color : Syntax
matplotlib.pyplot.plot(data1, data2, color-code) Example:
matplotlib.pyplot.plot(x, y, ‘r’) #’r’ is color code for red colour - Bar Chart: A bar chart is a graphical display of data using bars of different heights.
- Pyplot provides bar() function to create bar graph
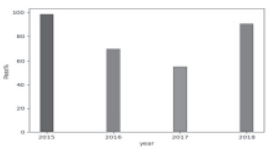
- Python program to display the year-wise result of a school using bar chart.
import matplotlib.pyplot as pl
year=[‘2015′,’2016′,’2017′,’2018’] # list of years
p=[98.50,70.25,55.20,90.5] #list of pass percentage
c=[‘b’,’g’,’r’,’m’] # color code of bar charts
pl.bar(year, p, width=0.2, color=c) # bar( ) function to create the bar chart
pl.xlabel(“year”) # label for x-axis
pl.ylabel(“Pass%”) # label for y-axis
pl.show( ) # function to display bar chart
OUTPUT:
• The bar( ) function has width argument to set the width of all bars. It has color argument also, to change the color of bars.
• Creating a horizontal bar chart: For this we can use barh( ) function (bar horizontal). Swap the names of axis labels.
Example:
import matplotlib.pyplot as pl
year=[‘2015′,’2016′,’2017′,’2018’]
p=[98.50,70.25,55.20,90.5]
c=[‘b’,’g’,’r’,’m’]
pl.barh(year, p, color = c)
pl.xlabel(“pass%”)
pl.ylabel(“year”)
pl.show( )
OUTPUT:

• Multiple Bar Charts:
Program:
import matplotlib.pyplot as pl
import numpy as np # importing numeric python for arange( )
boy=[28,45,10,30]
girl=[14,20,36,50]
X=np.arange(4) # creates a list of 4 values [0,1,2,3]
pl.bar(X, boy, width=0.2, color=’r’, label=”boys”)
pl.bar(X+0.2, girl, width=0.2,color=’b’,label=”girls”)
pl.legend(loc=”upper left”) # color or mark linked to specific data range plotted at location
pl.title(“Admissions per week”) # title of the chart
pl.xlabel(“week”)
pl.ylabel(“admissions”)
pl.show( )
OUTPUT:

- Pie Chart: A pie chart is a circular representation of data in the form of sectors.

- pyplot interface has pie( )function to create a pie chart.
- Example:

import matplotlib.pyplot as pl
part=[12,9,69,10]
explode=(0.1,0,0,0)
pl.pie(part,explode=explode)
pl.show( )
• Add Labels to slices of pie chart:
To display labels of pie chart, pie( ) function has labels argument.
Example:
import matplotlib.pyplot as pl
part=[12,9,69,10]
pl.pie(part, labels=[‘abc’,’pqr’,’xyz’,’def’])
pl.show( )
• Change the color of slices: Add colors argument to pie( ) function.
Example:
import matplotlib.pyplot as pl
part=[12,9,69,10]
clr=[‘g’,’m’,’y’,’c’] # list of colors
pl.pie(part, colors=clr, labels=[‘abc’,’pqr’,’xyz’,’def’], autopct=’%1.1f%%’) # adding colors
pl.show( )
OUTPUT: